Why it's not worth trying to equate CX scores to customer behavior
Yet another argument, this time from a slightly more technical angle
A common refrain among CX advocates is that improving the customer experience is good for business. They back up this claim with correlations between CX metrics and various business performance metrics. They sometimes think a favorable correlation gives them a golden ticket for securing resources and influencing others.
But reality isn’t so simple.
This post is the 4th in a series of arguments1 for why customer satisfaction just doesn’t translate to business value in the way people want. Specifically, this one focuses on the question: “If we find customer satisfaction is correlated with behavior, why can’t we just say it causes behavior?”
The short answer is that correlation doesn’t mean causation, but it seems like people tend to invoke this aphorism when it’s convenient and forget it when it isn’t. Further, I don’t think people are taught why correlation doesn’t mean causation, or what to do instead.
For this argument, I’m applying a fundamental tool of causal inference to the problem — Causal Diagrams, also known as DAGs (directed acyclic graphs).
Causal diagrams 101
A causal diagram allows someone to visually express their assumptions of how the world works, also known as the data generating process. If two people agree on a causal diagram, have access to the same data, and use the same analysis methods, they will find the same causal effect. If they disagree about how the world works, a causal diagram helps them express and debate their beliefs using common vocabulary.
I’ll start my argument with a simple overview of causal diagrams. You can find tons of information for free online if you want to go deeper2.
Nodes: Variables that affect other variables appear as objects in the diagram
Edges: Directional arrows connect nodes based on which node affects the other
Confounders: A common cause of the treatment variable and the outcome variable; if not controlled for, leads to bias when estimating the effect of the treatment on the outcome3
What people seem to believe
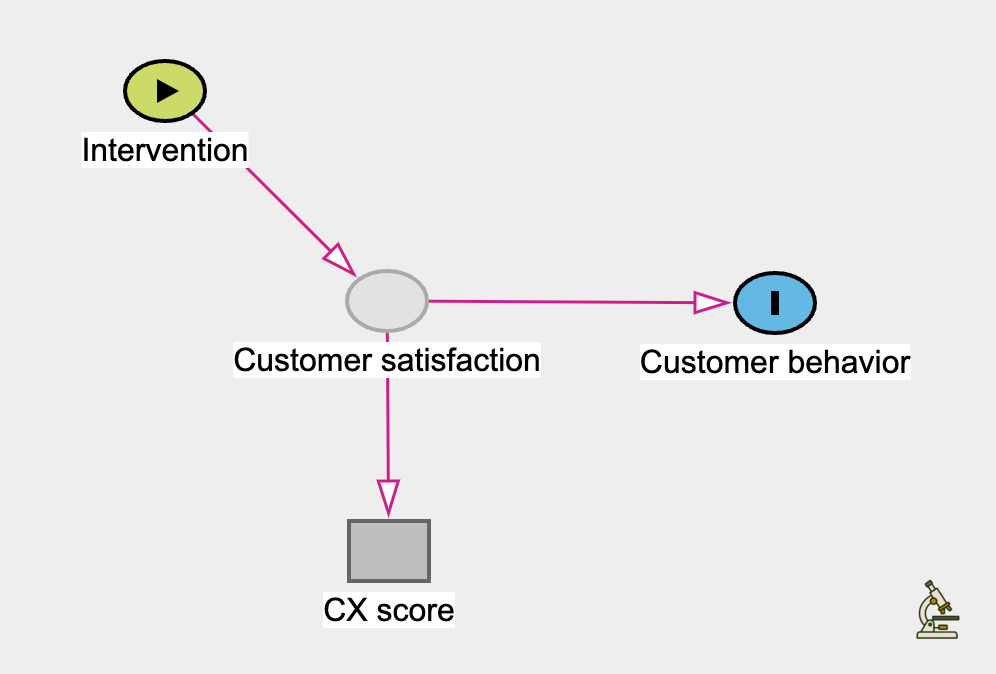
When someone wants to estimate the effect of customer satisfaction on behavior, they typically run a regression on the CX score and the customer behavior of interest. They use the coefficient from their results to say something like, “A 1% improvement in [CX score] results in an [x%] improvement in [customer behavior].” Sound familiar?
Based on this approach, we can reverse engineer their beliefs about how the world works. It would look something like the following4:

Sometimes they enrich their assumptions about the world with observable confounders (e.g. geography, seasonality, customer tenure, etc.), non-linear relationships between variables, changing relationships over time, etc. But at its heart, the diagram above is what is typically implied about people’s beliefs based on their approach to the analysis.
I actually don’t have any issues with what is in that diagram — my issue is with what is not in the diagram. The choice to exclude certain nodes and edges represents a collection of strong (and, I argue, unrealistic) assumptions.
Hidden assumptions
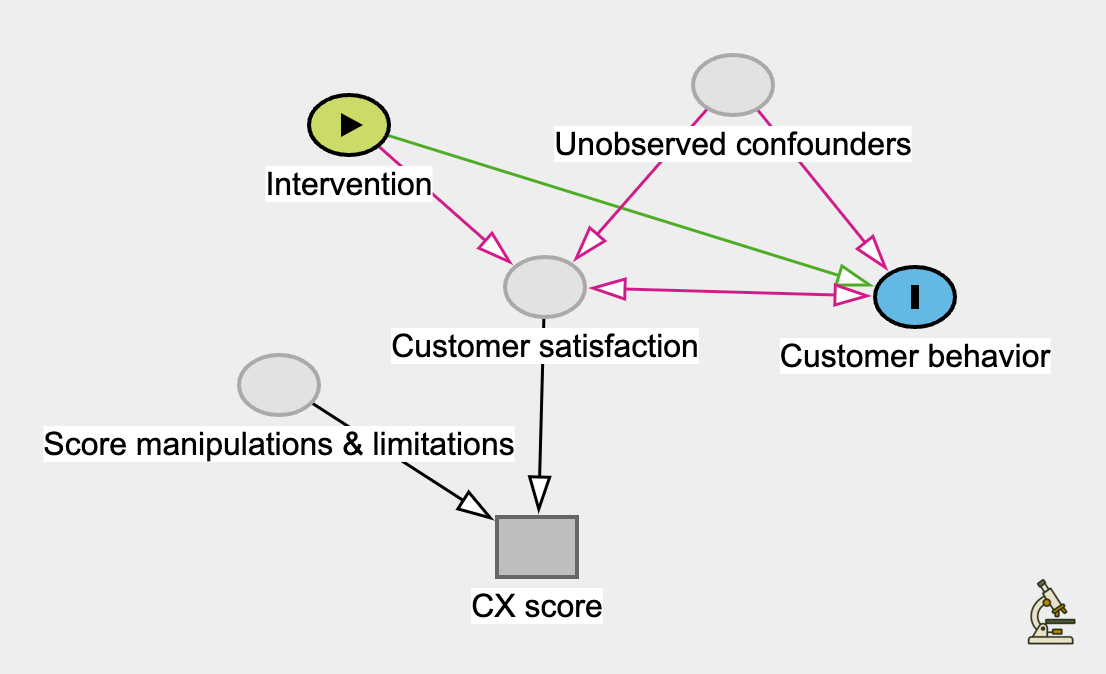
Hidden assumption #1: “CX scores are a good proxy for real satisfaction”
This is the least concerning to me of the hidden assumptions. It might not even cause an issue in many scenarios.
But it does break down when there is motivation for score manipulation. This happens when there are incentives based on CX scores (rewards for high scores or punishment for bad scores). An obvious example is when service managers at car dealerships ask customers to provide a 10/10 because, “anything less than 10 is a failure.”
It is also an issue if those who respond to a survey are different from those who don’t (e.g. if extremely dissatisfied customers are more likely to respond than other customers).
Further, it doesn’t allow for a long tail of extremely satisfied, or extremely dissatisfied, customers. They are all just grouped as the equivalent of 10/10, or 0/10, respectively. Maybe smart folks have figured out how to account for this? Please share if you know.
Hidden assumption #2: “There are no unobserved confounders of customer satisfaction and behavior”
I’m not worried about the observable confounders like geography and seasonality because people often already control for them. The issue is in the unobserved (or hard-to-observe) confounders — things like customer personality, customer expectations, competitor behavior, and macroeconomic factors. These factors affect customer satisfaction and behavior, but when they aren’t observable we can’t control for them.
If you agree, your causal diagram should include nodes for these confounders with arrows pointing at customer satisfaction and at customer behavior.
Hidden assumption #3: “A customer’s behavior doesn’t affect their satisfaction” (i.e. “no reverse causation between behavior and satisfaction”)
I would expect that customers who spend more, are more tenured, and/or pay for premium options are more likely to receive better experiences, resulting in higher satisfaction.
I also believe that the more someone uses a given product or service, the more likely they are to believe that they enjoy it. This is supported by theories of human psychology like confirmation bias, cognitive dissonance, mere-exposure effect, and effort justification.
If you agree with either of these points, your causal diagram should include an arrow pointing from customer behavior to satisfaction, not just the other way around.
Hidden assumption #4: “CX improvements only affect customer behavior through changes in customer satisfaction”
Has a company ever influenced your behavior without influencing your level of satisfaction? Maybe a company has:
used tactics like scarcity (“only 3 left!”) or social proof (“my hair now grows twice as fast!”) to get you to convert, without making your more satisfied
used a subscription model to make your payments more predictable and sticky
increased mental availability (e.g. increased ads, product placement, nudges at checkout, etc.) to get you to buy more
If you agree with this argument, your causal diagram should have an arrow directly from the intervention to customer behavior.
A more realistic model for reality
If I haven’t persuaded you on any of the points above, by no means are you required to include them in your causal diagram. That’s the benefit of a causal diagram — we can put our assumptions on the table and debate them. In case I have persuaded you, however, here’s what it would look like:

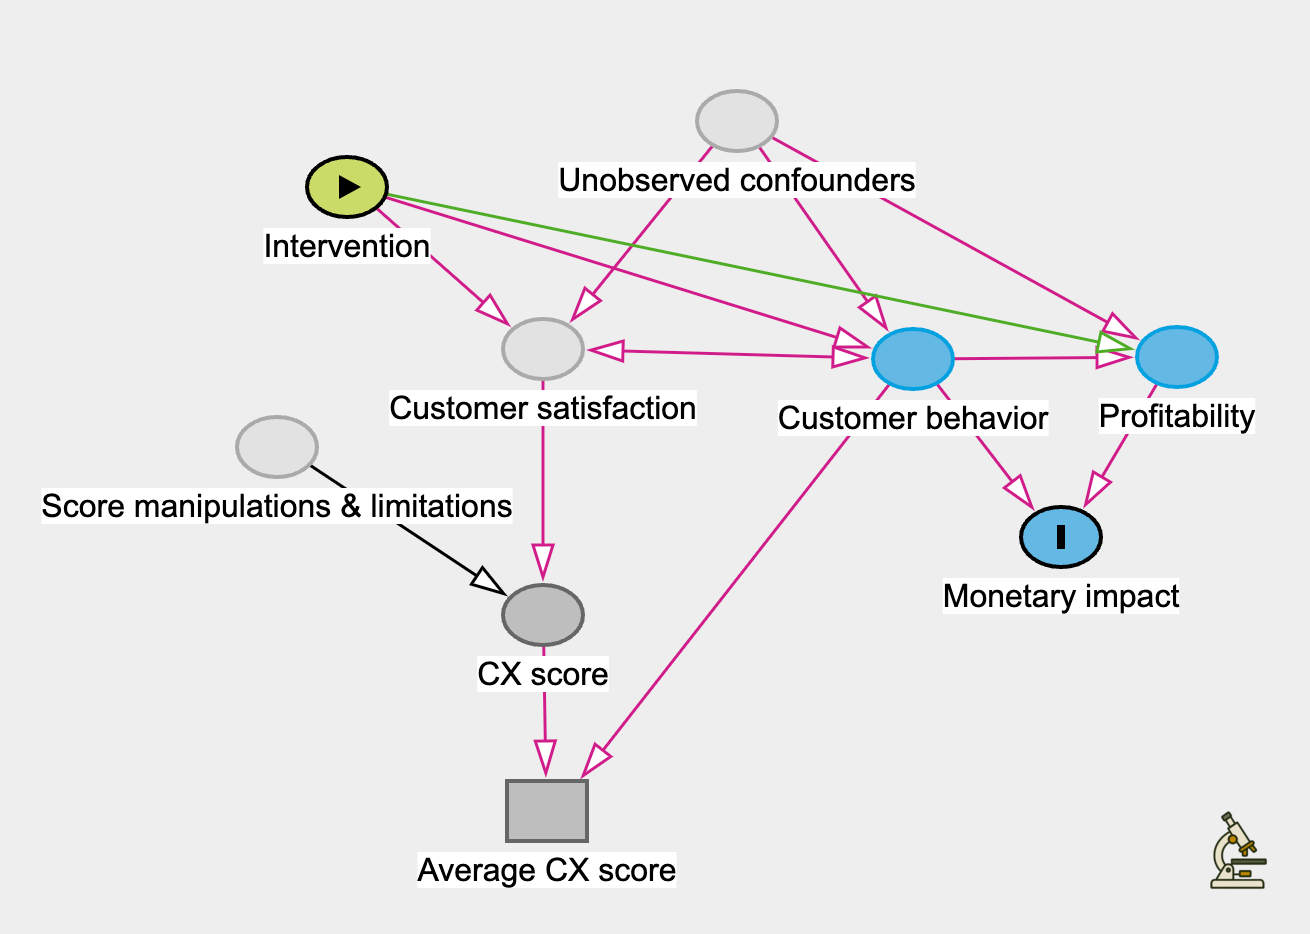
It gets even worse when people want to use an average CX score across the company or put a monetary amount on the score. I probably don’t need to build out that diagram to make my point (but it’s fun so I did anyway5).
Not even the right question
Now, it may not be impossible to equate satisfaction improvements to some probabilistic behavior change but I think it’s far harder than people realize and probably not worth the effort.
Fortunately, I don’t even think it’s the right research question. As a decision maker, I want to know how a specific initiative is going to impact customer behavior and what it will cost. There are limitless ways to increase customer satisfaction and while many will be good for business, many won’t. There are practical ways to estimate the impact a specific initiative might have on the business without having to rely on a dubious correlation. That’s what I’m looking for.
And for the CX team that is trying to justify its existence, a better path exists. I’d urge you to focus on showing 1. specific insights you brought to the business, 2. specific actions that you helped drive, and 3. what effect those actions had on the business. Even if you’re struggling with #3, doing a great job with #1 and #2 is often more than enough to get another round of support from the business.
If you’re interested, my journey started with The Book of Why, which I highly recommend
Leading people to believe there is a causal relationship when there really isn’t; hallucinations; spurious correlations
Thanks to dagitty.net for the free, online DAG builder


